
Investor relations
Financial Highlight

(in IDR million, unless otherwise stated)
| Description | 2020 | 2021 | 2022 | 2023 | 2024 | 2025 |
|---|---|---|---|---|---|---|
| Net Sales | 6,110,155 | 6,973,718 | 8,461,768 | 9,239,926 | 9,811,549 | 11,098,665 |
| Gross Profit | 1,319,205 | 1,476,592 | 1,780,350 | 2,027,052 | 2,077,544 | 2,248,496 |
| Total Profit Attributable to:Owners of the Company | 200,434 | 346,507 | 377,895 | 311,183 | 363,944 | 431,182 |
| Non-Controlling Interests | 5,155 | 4,963 | 4,210 | 7,895 | (212) | 3,988 |
| 205,589 | 351,470 | 382,105 | 319,078 | 363,732 | 435,170 | |
| Total Comprehensive Income Attributable to:Owners of the Company | 263,514 | 358,765 | 387,600 | 412,424 | 372,949 | 435,407 |
| Non-Controlling Interests | 5,180 | 4,966 | 4,214 | 7,902 | (230) | 3,995 |
| 268,694 | 363,731 | 391,814 | 420,326 | 372,719 | 439,402 | |
| Earnings per share | 21 | 37 | 40 | 33 | 38 | 46 |
| Total Assets | 5,680,638 | 6,297,287 | 6,878,297 | 7,166,880 | 7,454,096 | 8,313,889 |
| Total Liabilities | 1,025,042 | 1,277,906 | 1,467,035 | 1,335,148 | 1,249,645 | 1,736,341 |
| Total Equity | 4,655,596 | 5,019,381 | 5,411,262 | 5,831,732 | 6,204,451 | 6,577,548 |
| Return of Assets (%) | 3.65% | 5.87% | 5.8% | 4.54% | 4.98% | 5.23% |
| Return of Equity (%) | 5.18% | 7.27% | 7.33% | 5.68% | 6.04% | 6.62% |
| Net Profit Margin (%) | 3.36% | 5.04% | 4.52% | 3.45% | 3.71% | 3.92% |
| Current Ratio (x) | 4.36 | 3.58 | 3.26 | 3.56 | 3.86 | 3.15 |
| Liabilities to Equity Ratio (x) | 0.22 | 0.25 | 0.27 | 0.23 | 0.20 | 0.26 |
| Liabilities to Assets Ratio (x) | 0.18 | 0.20 | 0.21 | 0.19 | 0.17 | 0.21 |
| Asset Turnover (x) | 1.09 | 1.16 | 1.28 | 1.32 | 1.34 | 1.41 |
| Receivable Turnover (x) | 6.07 | 7.31 | 8.55 | 8.82 | 8.57 | 9.01 |
| Inventory Turnover (x) | 3.70 | 4.03 | 3.98 | 3.54 | 3.60 | 3.75 |
More about Investor Relations
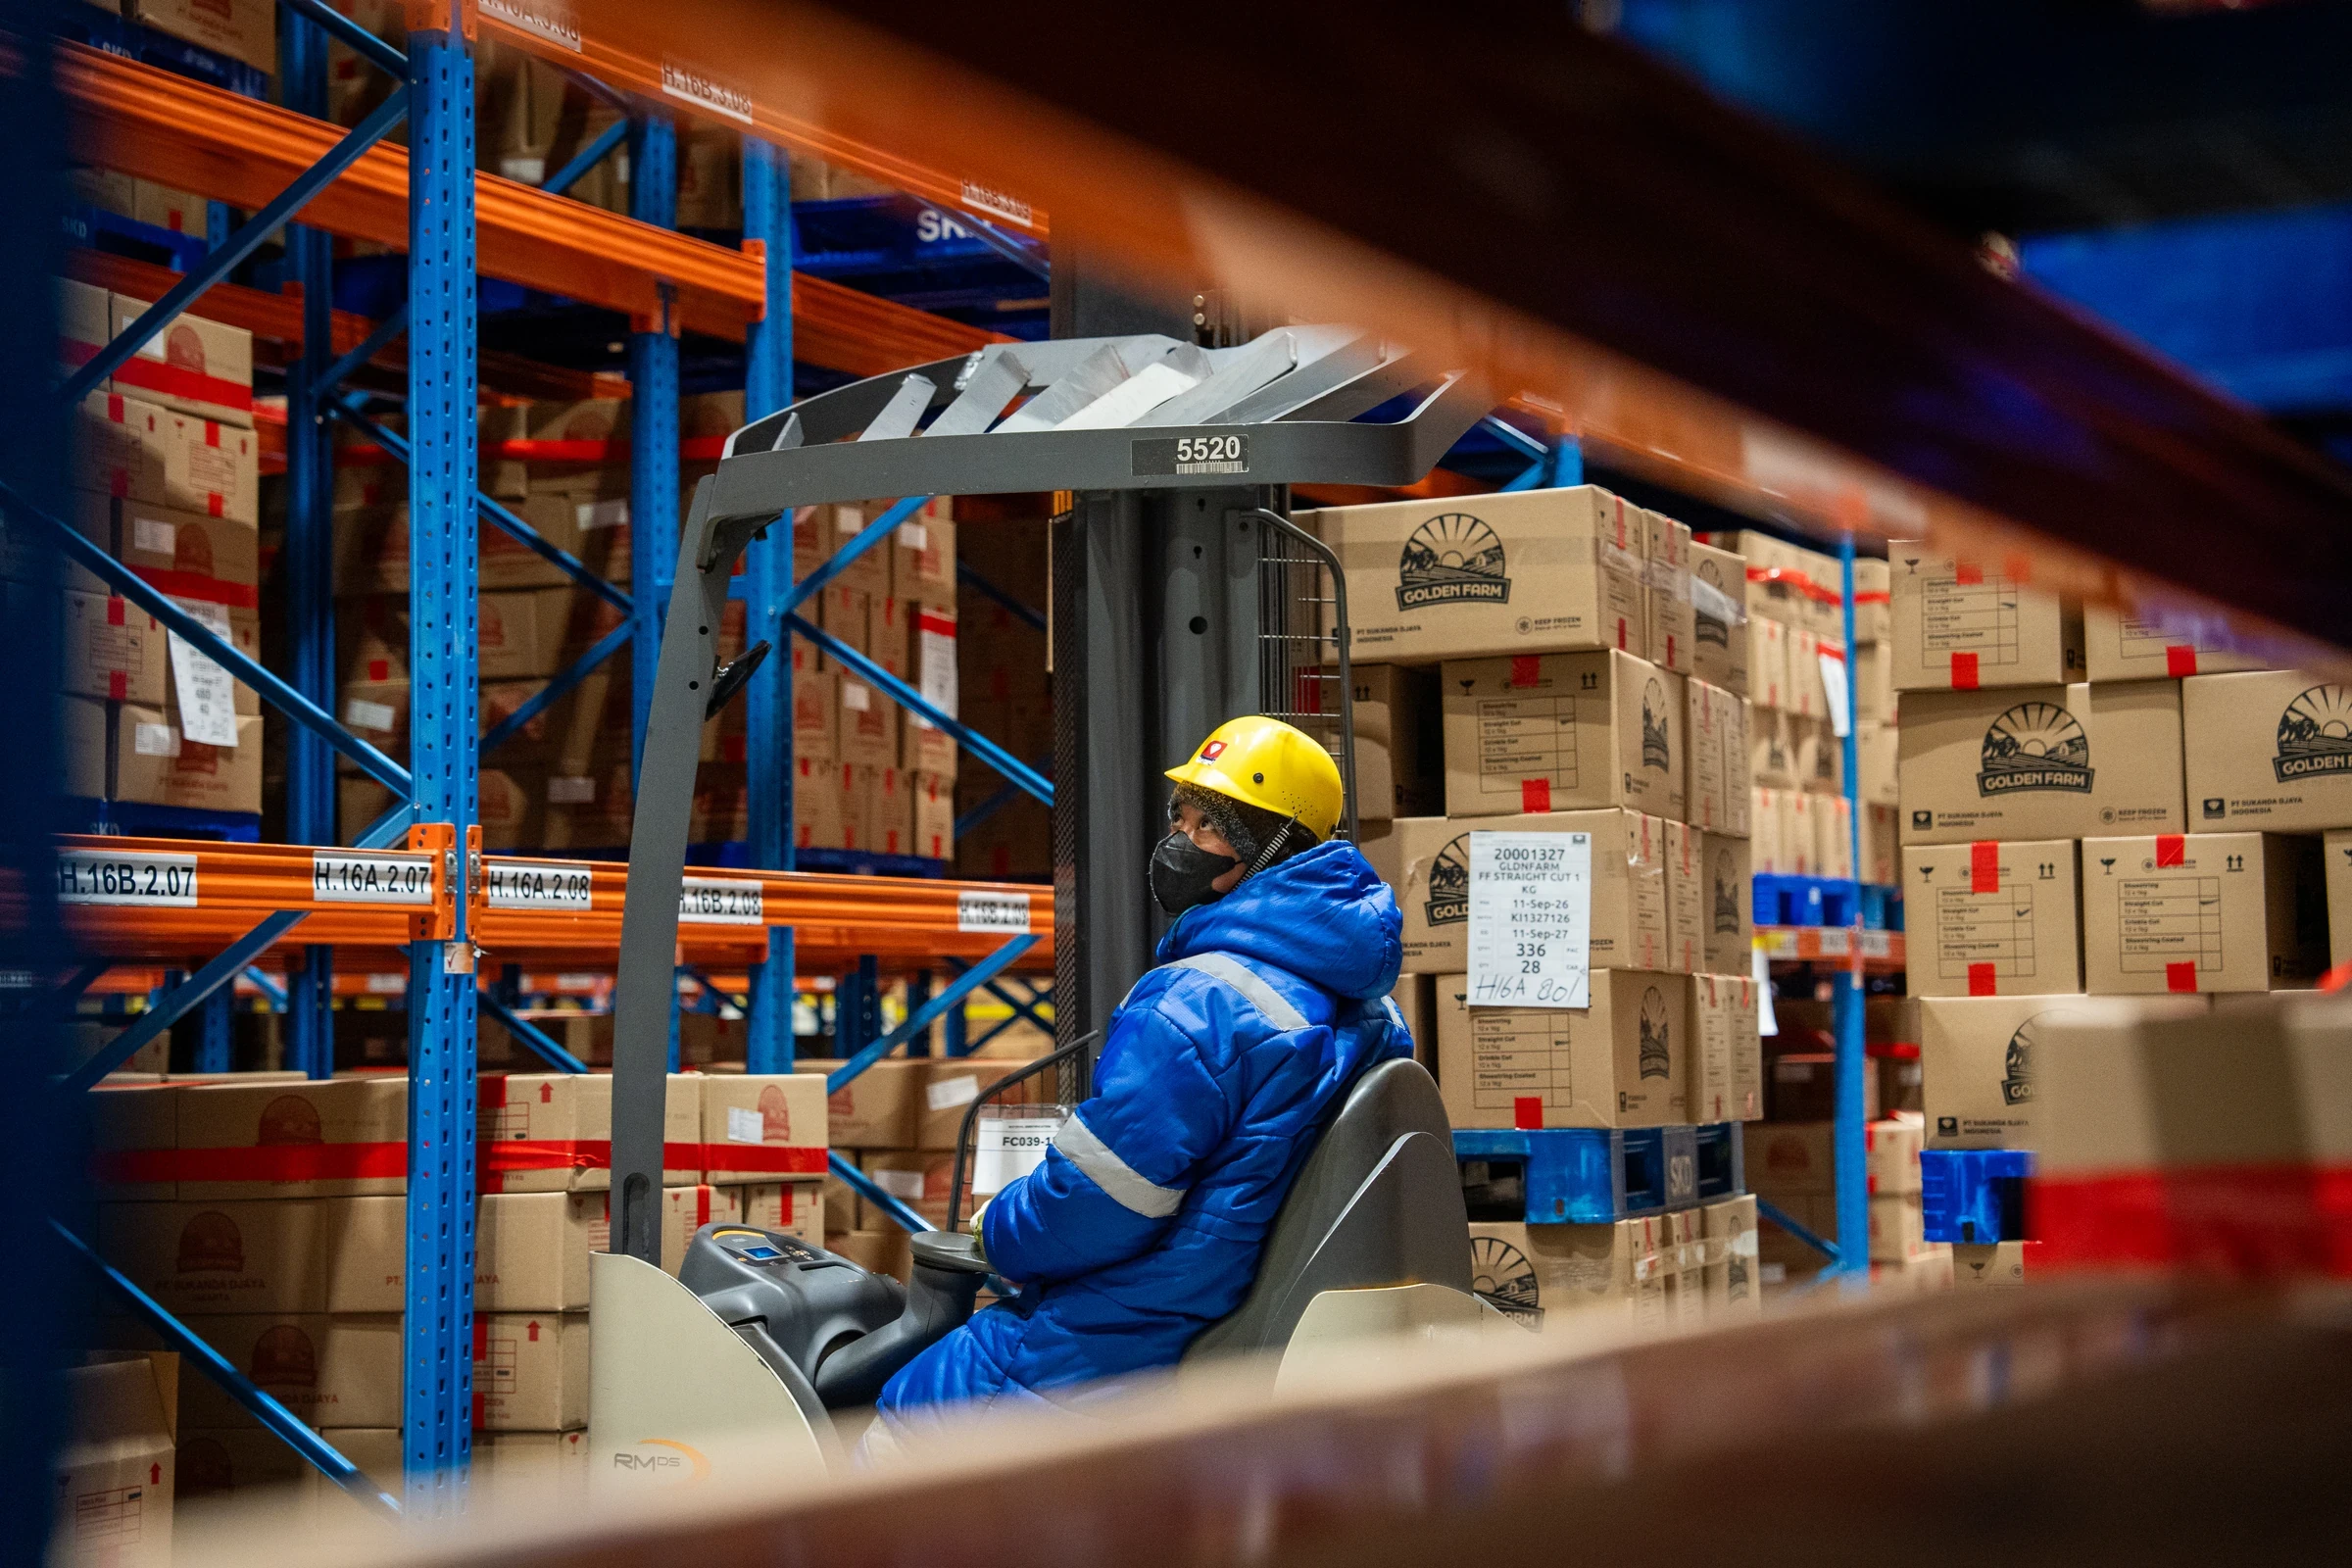
Built on experience. Ready for what's next.
With more than five decades of experience, we're continuing to build the capabilities, partnerships, and brands that shape the future of F&B in Indonesia.
Get in Touch